How to Measure Twitter Ads Performance
Image Credit Twitter for Business

Evaluating the performance of Twitter ad campaigns is crucial for optimizing results and maximizing your return on ad spend. By digging into the right metrics and analytics, brands can gain powerful insights into what’s working and how to improve.

In this comprehensive guide, we’ll explore the key concept and best practices for measure Twitter Ads Performance.

Setting Objectives and Defining Success

Begin by clearly defining campaign goals and what success looks like. Common objectives include:

  • Website clicks or conversions
  • Lead generation
  • Mobile app installs
  • Brand awareness or favorability
  • Video views
  • Follower growth
  • Engagement rate

Tie every goal to a quantifiable metric or KPI, for example, the target number of impressions delivered or increased ad recall for an awareness campaign.

This focuses efforts on outcomes that matter and enables optimization towards specific targets.

Tracking Core Metrics in Twitter Ads Manager
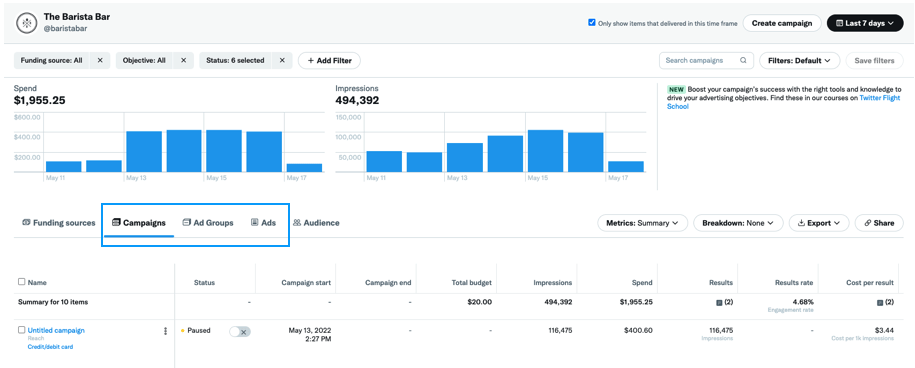
Tracking Core Metrics in Twitter Ads Manager
Image Credit Twitter for Business

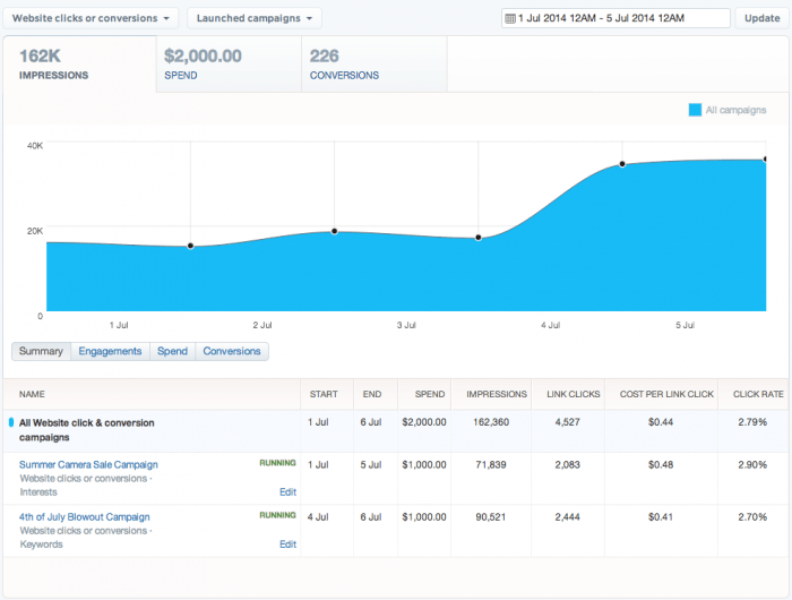
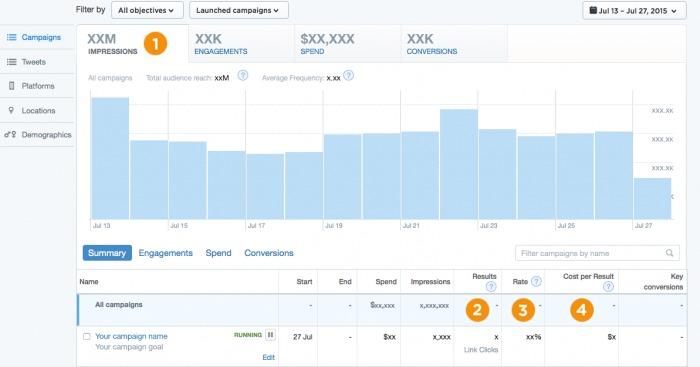
Twitter provides robust analytics within Ads Manager to monitor key performance indicators. Take advantage of these built-in reports:

Campaign Reach and Frequency

  • Impressions: Number of times your ads were shown. Evaluate overall reach.
  • Reach: Total number of unique accounts that saw ads. Measure audience size.
  • Frequency: How often each person saw ads on average. Monitor saturation.
  • CPM: Cost per thousand impressions. Assess media efficiency.

Engagement Performance

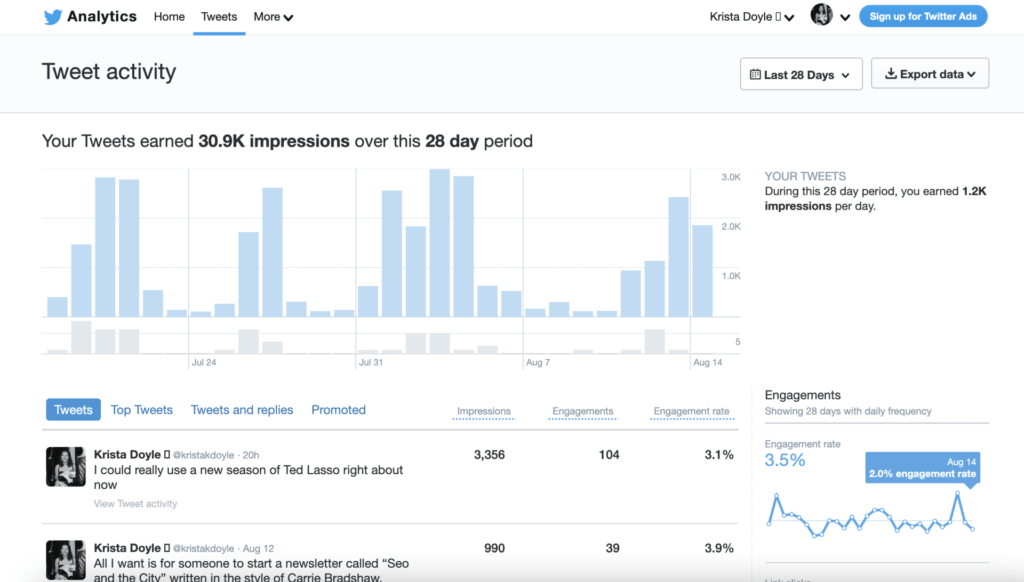
  • Engagements: Total clicks, likes, retweets, and other interactions. Track overall engagement.
  • Engagement rate: Engagements divided by impressions. Benchmark engagement quality.
  • Video views: Number of times video ads were viewed for 2+ seconds. For video-centric campaigns.
  • Followers gained: New followers acquired from Promoted Accounts campaign. Measure follower growth.

Landing Page Metrics

  • Link clicks: Total ad clicks leading to destination URLs. Evaluate interest and traffic.
  • CTR: Clicks divided by impressions. Assess ad relevance and click-through motivation.
  • Conversion rate: Percentage of clicks becoming conversions. Trackability to convert traffic.
  • CPC: Cost per click. Measure the average cost to drive a click.
  • CPA: Cost per acquisition. Calculate the cost-effectiveness of driving conversions.

Analyze this data daily to assess campaign trajectory and quickly catch any issues. Optimize based on insights.

Also read: Case studies of successful Twitter Ads

Calculating Return on Ad Spend (ROAS)
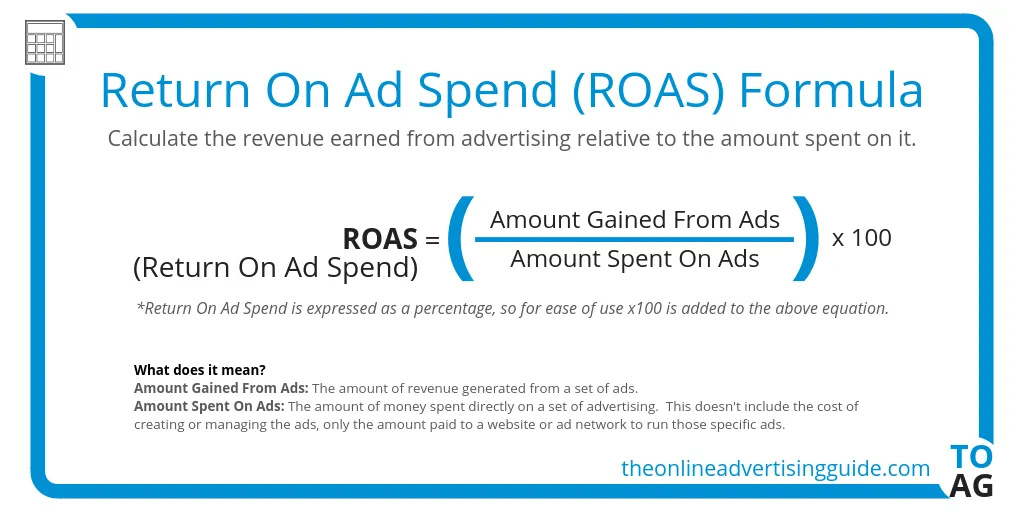
Calculating Return on Ad Spend
Image Credit The Online Advertising Guide

The key performance indicator for Twitter Ads is ROAS – return on ad spend. This measures the profit generated per dollar spent on advertising.

ROAS = Revenue from campaigns / Total ad cost

To calculate:

  • Add up all revenue generated via Twitter Ads conversions.
  • Divide by total Twitter Ads spent for the period.

ROAS demonstrates financial return and helps determine efficient spending levels. A ROAS above 1:1 means campaigns are profitable.

Conducting A/B Testing

A/B split testing different ad variations is vital to improving performance over time.

To A/B test:

  • Create two ad variations – different copy, creatives, and calls to action.
  • Promote evenly to similar target segments.
  • Inspect metrics like CTR and conversion rate for each.
  • Declare winning variation and promote that in the future.

The scientific testing process lets you refine ads by learning which resonates best with your audience.

Measuring Brand Lift

Brand lift reveals how your ads impacted brand perception and sentiment. Twitter’s Brand Lift study can measure the following:

  • Ad recall: Percent who recall your ad. Assess brand memorability.
  • Brand awareness: Change in brand awareness due to ads. Measure awareness lift.
  • Brand favorability: Percent with improved brand opinion after seeing your ads. Track brand sentiment changes.
  • Purchase intent: Change in buying likelihood from the brand. Identify sales potential.

Brand studies require large sample sizes for statistical significance. But they provide powerful brand health insights.

Optimizing Based on Campaign Insights
Best Practices and Optimization for Twitter Ads
Image Credit Twitter Blog

Consistently act on the insights uncovered through measurement to improve future Twitter Ads performance:

  • Remove poor-performing targeting or placements based on low engagement rates.
  • Strengthen bids and budget allocation towards high-performing segments.
  • Kill low ROAS ads and promote winners based on returns.
  • Refine messaging for audiences driving conversions.
  • Monitor frequency and avoid saturation which causes diminishing returns.
  • Re-engage previous video viewers or site visitors via Custom Audiences.

Regular optimization drives major lift over time as you align campaigns with the highest converting audiences and creatives.

Building Reporting Dashboards

Design custom reporting dashboards to track KPIs in one place over time easily. Useful features:

  • Set up an overview tab with top metrics like ROAS, clicks, conversions
  • Filter data by campaign, period, and dimensions
  • Visualize data through graphs and charts for trends
  • Include comment boxes to note insights on what’s working
  • Automate reporting through Google Sheets or Data Studio

With campaigns scaling, unified dashboards create visibility so you can take action faster.

Leveraging Third-Party Analytics
Leveraging Third-Party Analytics
Image Credit Twitter for Business

Complement Twitter’s internal analytics with third-party tools for deeper analysis:

  • UTM campaign tags: Track clicks and conversions from Twitter Ads via Google Analytics.
  • Cyfe: Monitor multiple marketing channels in a unified dashboard.
  • Zoho Analytics: Visually analyze and slice Twitter Ads data.
  • TapClicks: Pull cross-channel ad reporting.
  • AdStage: Unify Facebook and Twitter Ads in one platform.
  • Twitter Media Studio: Digital asset management for creative testing.

Each platform provides additional visibility based on its specialized dashboards. Integrate where helpful.

Twitter’s Ongoing Analytics Developments

Twitter is investing heavily in analytics capabilities to help brands:

  • Launched new web conversion tracking endpoints for attributing Twitter Ads’ impact.
  • Introduced support for Apple Search Ads attribution via SKAdNetwork 2.0.
  • Added new “Audience Insights” tool with detailed analytics on your customers’ interests, demographics, and behaviors.
  • Built aggregated measurement partnerships with analytics platforms to help show true marketing impact.

As Twitter ads analytics grow more robust, marketers gain more power to track returns and optimize performance.

Conclusion

Measuring Twitter Ads should be an integral part of any brand’s campaigns, not an afterthought. By setting clear objectives, tracking engagement and conversion metrics, calculating true ROAS, running A/B tests, monitoring brand impact, and optimizing based on insights – you’ll ensure dollars are being spent efficiently in driving real business results.

Analyzing performance data leads directly to higher returns. As Twitter expands its analytics capabilities, building a measurement-focused approach is imperative to maximize ad impact long-term.

Similar Posts