Visual content has become indispensable on social media for capturing attention and quickly communicating messages. On a primarily text-driven platform like LinkedIn, images, graphics, charts, videos, and other multimedia formats are highly engaging and optimize reach.
Implementing compelling visuals can significantly amplify the impact of your LinkedIn posts. This guide will provide research-backed best practices on the various types of visuals to create and share and strategies for using them effectively.
Table of Contents
The Power of Visuals on LinkedIn
Here’s an overview of how incorporating visuals boosts your LinkedIn content:
- Enhances engagement – Posts with images see 98% more views and comments than text-only posts.
- Improves clarity – Visuals illustrate complex ideas and data simply and memorably.
- Humanizes your brand – Photos showing company culture make organizations more relatable.
- Drives sharing – Articles with images are shared 6X more than those without according to Buffer.
- Provides flexibility – Infographics evolve with new data. Images remain evergreen conversation starters.
- Saves time – Viewers process images 60,000X faster than text according to Facebook.
- Increases reach – Eye-catching photos and videos attract new audiences organically.
- Supports storytelling – Visuals create narratives and elicit emotions that text alone cannot.
- Builds authority – Consistently sharing quality visuals exhibits thought leadership.
There are tremendous benefits to incorporating visuals into your LinkedIn content strategy. So which formats should you create and how do you optimize them for maximum impact?
Also Read – Job Scams on LinkedIn: How to Spot and Avoid Them
Top Visual Formats To Use in LinkedIn Posts
Experts recommend focused visual diversity. While variety engages, you’ll see the best results emphasizing a cohesive style consistent with your brand. Recommended options include:
1 Photos
- Company events, team, and workspaces
- Infographics
- Original stock photos
2 Infographics
- Data trends, market overviews
- How-to processes, guides
- Quotes, advice
3 Videos
- Product demos
- Customer testimonials
- Thought leadership commentary
4 Presentations
- Research findings, industry analysis
- Proprietary frameworks, models
- Expert seminars, speeches
5 Live Videos
- Q&As, interviews, AMAs
- Virtual event coverage
- Industry Commentary
Aim for a 70/20/10 mix of photos, infographics/presentations, and videos. Infuse your unique brand personality into designs.
Sourcing Quality Visual Assets

Visually engaging, branded assets don’t have to cost a fortune. Take advantage of affordable options:
Stock Photography Sites
- Unsplash (Free)
- Pexels (Free)
- iStock ($)
- Shutterstock ($)
Graphic Design Services
- Canva (Free and paid plans)
- Venngage (Free and paid plans)
- Fiverr (Affordable freelancers)
Video Creation Tools
- Biteable (Free and paid plans)
- Animoto ($)
- InVideo (Free and paid plans)
Presentation Tools
- Google Slides (Free)
- Visme (Free and paid plans)
- Beautiful.ai ($)
Original Company Assets
- Product images/videos
- Event photos
- Team headshots
- Branded graphics
- Webinar recordings
- Presentation decks
Repurpose top-performing visuals from your other marketing channels too.
Crafting Compelling Captions
Don’t let amazing visuals go to waste with weak captions. Craft descriptive copy that makes viewers eager to click.
Vague: “Check out our latest ebook!”
Specific: “Here’s a sneak peek of the essential KPIs covered in our new analytics ebook this week.”
Best Practices
- Describe the visual’s significance
- Explain the broader context
- Include a clear call to action
- Direct viewers to click links
- Ask a thought-provoking question
- Incorporate key hashtags
Captions convince people why they should care about your visual enough to engage further.
Structuring Visual Posts for Maximum Impact
How you format visual assets within your posts influences how attention-grabbing they are in feeds. Use these structuring tips:
Place Visuals At the Top
Lead with the visual hook before caption text for immediate impact.
Optimize for Mobile
Mobile accounts for over 90% of LinkedIn usage. Ensure visuals are vertical and readable on small screens.
Include Logo
Brand all graphics with your logo, color palette, and fonts for memorability.
Size Matters
Bigger is better. Large, full-width images get more engagement than smaller thumbnails.
High Resolution
Upload the highest resolution files possible to prevent pixelation. At least 1024 x 512 pixels.
Use whitespace
Leave ample blank space around text and graphics so the design is uncluttered.
Limit Text Overlays
Avoid excessive captions covering the entire image. Use transparent text boxes sparingly to maintain visual integrity.
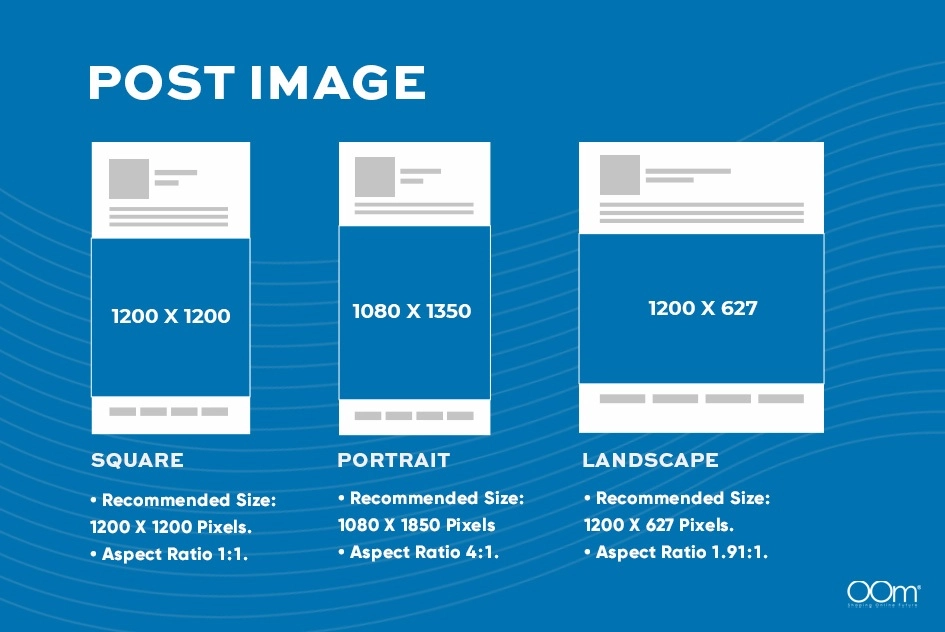
Proper Image Dimensions
Standard image post dimensions are 1200 x 627 pixels. Switch to landscape 1080 x 1920 pixels for mobile scrolling.
Optimized structure means your great visuals are delivered in their best possible form.
Amplifying Reach Through LinkedIn’s Algorithm

You can strategically maximize visual content circulation by optimizing for LinkedIn’s algorithm.
Post at Peak Times
Tuesday, Wednesday and Thursday afternoons see the highest engagement based on LinkedIn data.
Use Keywords
Include industry keywords so your visuals appear in relevant search results.
Post at High Frequency
Posting daily yields 86% more engagement than weekly according to HubSpot.
Follow Influencers
Like and share visual posts from leaders in your niche to access their networks.
Cross-promote on Other Platforms
Driving external traffic to your LinkedIn posts signals value to their algorithm.
Pay to Boost Key Posts
Your best-performing pieces are prime candidates for sponsored boosting to expand visibility.
Vary Visuals in a Series
The algorithm detects your expertise when you share multiple varied visuals on a theme.
Tag Relevant Connections
Your network engages at higher rates when personally tagged in your posts.
Consistent, optimized practices will ensure your visuals get maximum exposure and engagement.
Best Practices for LinkedIn Visual Post Engagement

It’s not enough to just publish great visual content. You need to actively engage with your audience to make the most of visual assets.
React to Comments Quickly
Reply to respond to questions and sustain dialogue around your visuals.
Ask Follow-Up Questions
Pose questions in the caption or comments to spark extended discussion.
Share User-Generated Visuals
Repost photos from followers and events to highlight the community.
Give Value-Adding Feedback
Provide constructive thoughts on visual posts in your niche to guide peers.
Like and Share Others’ Visuals
Interact with leaders’ and contemporaries’ visual content to access their networks.
Tag Connections
Notify relevant colleagues about visual posts that would interest them specifically.
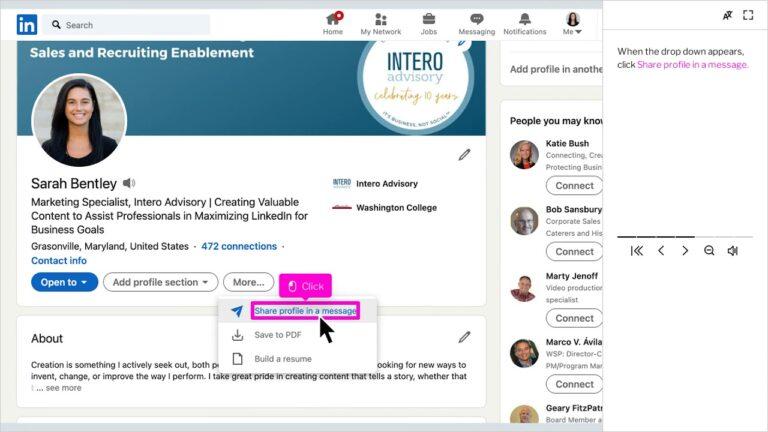
Send Direct Messages
Personally share significant visual posts one-on-one with key stakeholders.
Promote Through Email Marketing
Re-highlight your top visual pieces by linking to them in email newsletters.
Monitor Performance
Track impressions, engagements, clicks, follows, and comments to guide your strategy.
Remember – quality engagement centered around visual assets amplifies their impact over simply publishing and leaving them alone.
Tips for Creating High-Converting LinkedIn Visual Posts
Here are some proven best practices to make your visual content highly clickable:
Promote Off-Platform Assets
Drive traffic to visual assets on your site like infographics, whitepapers, and slide decks.
Localize Globally Resonant Messages
Adapt evergreen concepts with local stats and examples to engage your audience.
Utilize FOMO
Promote limited-time offers, access, downloads, or events to incentivize clicks.
Pose Provocative Questions
Compelling questions pique curiosity and comments. Open-ended works best.
Incorporate Company Personality
Injecting humor and conveying brand voice makes your visuals more shareable.
Feature Relatable Experiences
Humanizing your messages drives engagement. Tell real stories.
Highlight User Benefits
Focus visuals on communicating the value consumers gain.
Simplify Complex Concepts
Break down sophisticated ideas into digestible visuals to capture interest.
Embrace Controversy Carefully
Thoughtful contrarian stances stand out but avoid being extreme.
Make It Actionable
Clearly state the next steps viewers should take after seeing your visual.
Well-crafted visuals that provide value and speak directly to your audience will convert attention into measurable actions.
Tracking Performance of LinkedIn Visual Efforts
You can’t improve what you don’t measure—Leverage LinkedIn’s analytics to assess your visual content efforts.
- Impressions – # of times visual is displayed
- Clicks – # of clicks to links or external sites
- Engagement – Likes, comments, shares
- Traffic drivers – Pinpoint highest traction sources
- Follower growth – New followers attributable to visuals
- Mentions – Being referenced by others due to visuals
- Leads generated – Conversions driven specifically by visual assets
Compare performance across different formats, posting days and times, captions, hashtags, and promotion tactics. Eliminate what underperforms and double down on what proves most effective.
Also Read – Optimizing your LinkedIn Presence as a Researcher
Key Takeaways for Mastering Visuals on LinkedIn
The most compelling brands on LinkedIn make visual storytelling central to their content approach. To continually refine your visual presence:
- Focus on quality over quantity – Thoughtful, branded visuals beat random stock images.
- Monitor analytics – Identify your best formats, engagement tactics, and high-traction content.
- Iterate and improve – Build on successful tests, and eliminate underperformers.
- Respond to your audience – Sustained dialogue and community drive results.
- Remain consistent – Schedule recurring visual posts to build steady visibility.
- Be helpful first – Visuals that solve problems or educate attract more followers.
- Have fun! – Don’t be afraid to show personality and experiment.
With strategic effort, visually captivating LinkedIn posts will engage your audience and demonstrate thought leadership.
What are your favorite practices for using visuals effectively? Which visual content performs best for your brand? I’d love to hear your experiences and advice below!