Engagement rate is one of the most important metrics to track the performance of your Twitter ad campaigns. It measures how effectively your ads resonate with your target audience.
By calculating engagement rates, you can identify opportunities to optimize your targeting, messaging, and creativity to drive higher results.
In this comprehensive guide, we’ll break down how to accurately measure the engagement rate for Twitter ads. You’ll learn benchmarks for good, average, and bad engagement rates across objectives and formats. You’ll also gain actionable tips to improve your own Twitter advertising engagement rates over time.
Table of Contents
What is Twitter Ad Engagement Rate?
The engagement rate for Twitter ads measures the percentage of users who engaged with your ads out of the total number of users they were shown to. The formula is:
Engagement Rate = (Engagements / Impressions) x 100
Engagements are actions like clicks, retweets, likes, follows, card actions, etc. Impressions refer to the number of times your ads were displayed.
This shows you what proportion of the audience you reached found your ads relevant enough to engage with. Higher rates signal your content and targeting is resonating.
Average Engagement Rates on Twitter
While averages vary significantly based on factors like industry, creative, and objectives, these benchmarks for Twitter ad engagement can serve as a useful reference:
Average Twitter Ad Engagement Rate
- 0.5% – 2% overall
Engagement Rate by Format
- Promoted Tweets: 0.5% – 2%
- Video Views: 0.5% – 5%
- Website Clicks: 1% – 5%
- Conversions: 2% – 15%
- Follows: 0.5% – 2%
Engagement Rate by Objective
- Branding Awareness: 0.2% – 1%
- Website Traffic: 0.5% – 2%
- Video Views: 1% – 6%
- Conversions: 3% – 15%
- Followers: 0.5% – 2%
Monitor your own engagement metrics over time to determine benchmarks tailored for your brand, audience and industry.
How to Calculate Twitter Ad Engagement Rate
You can calculate your Twitter ad engagement rate in a few simple steps:
Step 1) In Ads Manager, find the engagement column for your campaign. This shows actions like clicks, favourites, retweets, etc.
Step 2) Locate the impressions column, which indicates how often your ad was displayed.
Step 3) Take total engagements and divide by total impressions.
Step 4) Multiply the result by 100 to convert it to a percentage.
The final percentage is your engagement rate. You can filter by ad, objective and date range to analyze further.
Good vs. Bad Engagement Rates on Twitter
As a general rule, here are guidelines for good and bad Twitter engagement rates:
Good Twitter Engagement Rate
- Branding Awareness: 0.5%+
- Traffic/Leads: 1%+
- Video Views: 2%+
- Conversions: 5%+
- Followers: 1%+
Low Twitter Engagement Rate
- Branding Awareness: <0.2%
- Traffic/Leads: <0.5%
- Video Views: <1%
- Conversions: <2%
- Followers: <0.5%
If your engagement rate falls into a lower category, there are opportunities to optimize your targeting, messaging, creative assets and bidding to boost performance.
How to Improve Twitter Ad Engagement Rate
Here are proven tips to improve engagement rates for your Twitter ad campaigns:
- Use images, videos and visuals in your ads
- Personalize ad copy with audience/industry language
- Share valuable or entertaining content
- Promote relevant current events or trends
- Retarget engaged website visitors
- Test different bidding strategies
- Monitor and quickly pause low-performing ads
- Refine targeting to remove irrelevant users
- Ask questions or promote engagement in copy
- Use polls, quizzes or interactive content
Continuously optimizing your ads based on performance data is vital. Test new ideas until you find what makes your audience tick.
Twitter Ad Campaign Case Studies
Here are examples of real brands driving strong Twitter ad engagement:
Microsoft’s Xbox – 8% Engagement for Game Pass Trial Promotion
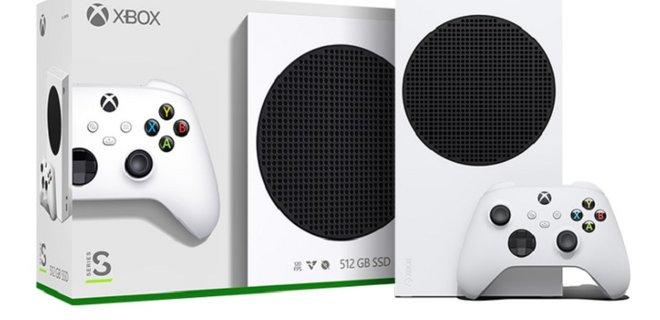
Microsoft achieved an 8% engagement rate promoting a free Xbox Game Pass trial by targeting gamers 18-35 with video ads. Their video ad visuals and messaging strongly resonated with the core gamer demographic.
Wendy’s – 4.5% Engagement for National Cheeseburger Day Promotion
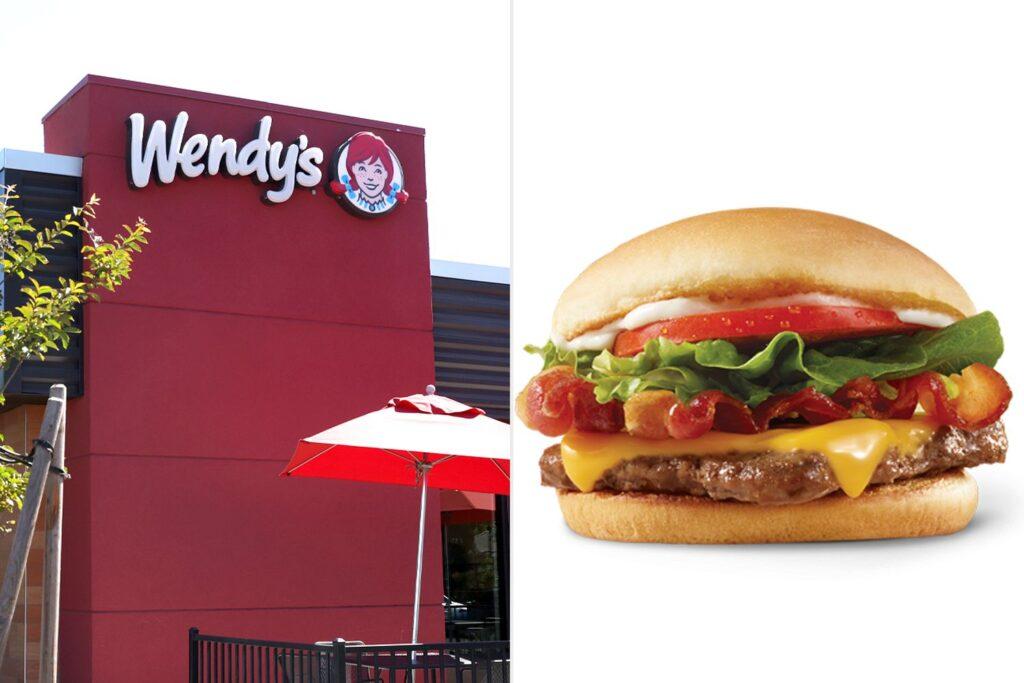
For National Cheeseburger Day, Wendy’s asked followers to tweet their favourite burger toppings. Their Promoted Tweet tied to a timely cultural moment and proprietary assets hit a 4.5% engagement rate.
Adidas – 3.2% Engagement for Sneaker Launch Targeting Sneaker Fans

When launching new sneakers targeting “sneakerhead” interests and @handles, Adidas creatives showcasing product shots hit a 3.2% engagement rate by tapping into audience passion.
Disney+ – 1.5% Engagement Targeting Families for Streaming Promotion

Disney+ effectively targeted parents with young kids, highlighting their family-friendly catalogue. Their 1.5% engagement rate for a lower-funnel streaming offer reflects strong creativity and targeting.
Optimizing ads for your unique audience and their passions is key for engagement.
Common Twitter Engagement Rate Mistakes to Avoid
Steer clear of these common Twitter advertising engagement mistakes:
- Using boring stock images or brand logos only in ad creative
- Generic ad copy that is overly salty or corporate
- Targeting too broad an audience with irrelevant messaging
- Not having a strong, unique value proposition and CTA
- Redirecting clicks to a cluttered homepage without a clear goal
- Drastically changing targeting or creativity too frequently
- Bidding too conservatively to lower costs vs optimize engagement
- Letting poor-performing ads run too long before pausing
- Not monitoring daily to assess engagement levels
Addressing these issues can help you achieve consistently stronger engagement rates over time.
Conclusion
Calculating engagement rates for your Twitter ad campaigns provides vital insights into your targeting relevancy and creative resonance. While averages vary, engagement above 1% for branding and 2%+ for conversion objectives reflects strong performance.
Optimizing toward higher engagement involves an investment in compelling visuals, strategic targeting, and dynamic messaging tailored to your audience. The payoff is multiplied ad results and bigger business impacts from your Twitter advertising spend.

